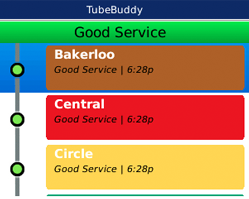
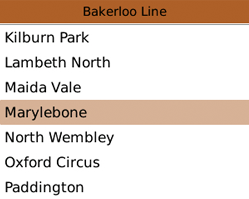
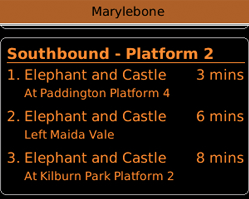
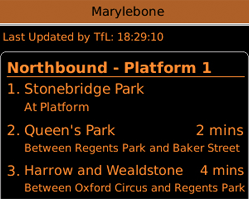
The same data used to create the live tube map was also put to use making a free, third party app called TubeBuddy. TubeBuddy enables the user to check the status of their tube line on their phone, with it displaying service updates if there are delays. It also has a live departure board feature, with the user able to check when the next train is arriving at their station, where its destination is, and where the train currently is in relation to the station that has been selected. This is useful if you want to check to make sure you're not going to be delayed, especially if you're already travelling and want to check quickly before attempting to use the tube. It also has a function where you can receive automatic updates on a selected line, so you get alerts sent to your phone should there be a problem somewhere.

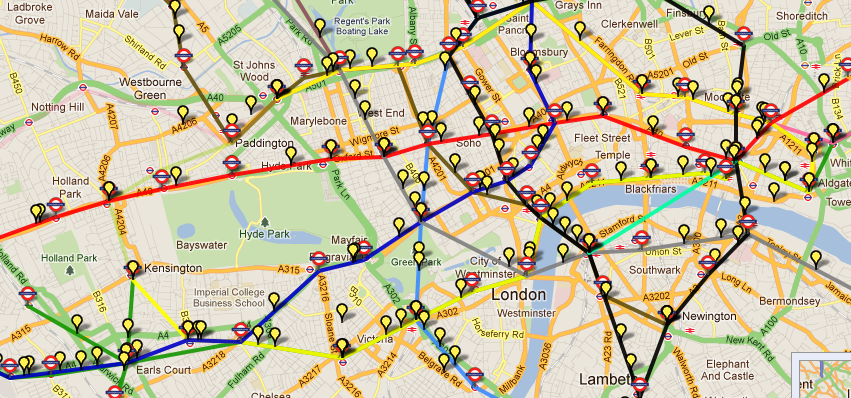
This website contains a map showing where all the tube trains are on the underground network, in approximate real time. This was done by grabbing API data from TfL during Science Hackday 2010 in London. The API data from TfL is actually available for people to use in order to create websites such as this, and other things such as mobile phone apps displaying live departure data. However, despite TfL calling it Open Data, it's actually only available if you get permission from them to use it. You have to specify what you're going to use it for, where you're going to use it, and how many people are likely to see it. So TfL still have control over the use of the data, and is only shared if they like what you're going to do with it.
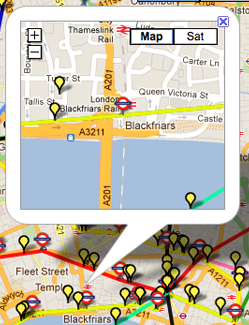
Below is a screenshot of the map. Yellow balloons represent each train, with the underground roundels showing the location of each station:
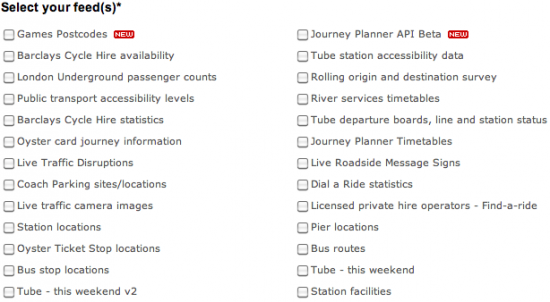
Left: A screenshot of the list of data feeds that TfL have made available for people to request. There is a fairly wide range of data that has been made available, leaving the door open for some interesting outcomes. From a personal viewpoint, I feel that some feeds are less versatile than others, for example the pier locations feed, as there isn't much data that can be gathered and presented. Others, however, are of more interest to the general public and could provide the basis for a valuable tool for Londoners, such as tube station accessibility data.


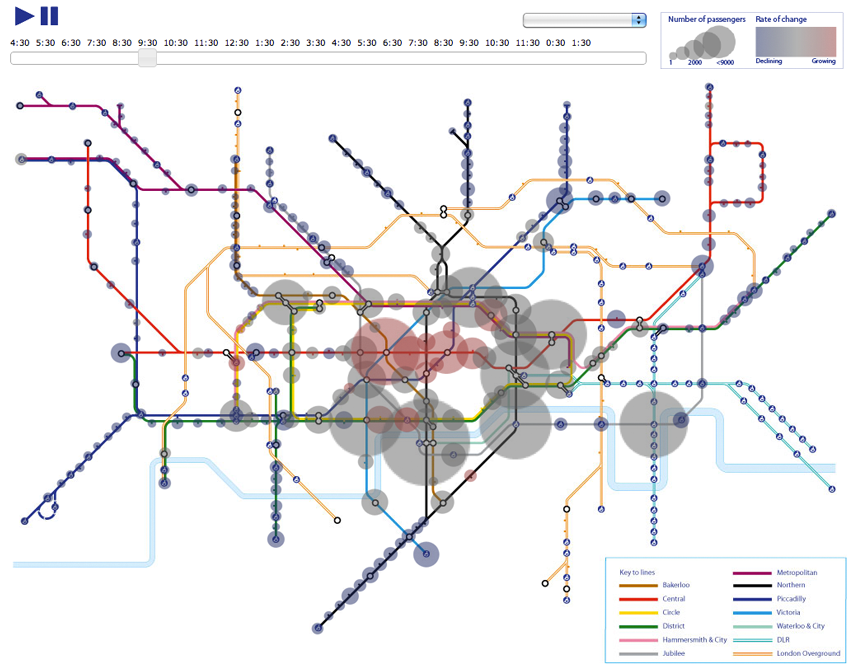
TubeViz is a data visualisation map using passenger number data - it shows passenger numbers during the day at every London Underground station, in a visual format. The circles show the number of passengers, and the colour shows whether the numbers are increasing or decreasing at that particular time of day. For example, it is possible to see that at Victoria tube station, the passenger numbers are well above 9,000 between 7.30am and 8.30am, and also we can see that the passenger numbers are still growing, as the circle is red. By showing this data, it makes it possible to see which stations have the largest passenger numbers, at which times. This makes it a handy tool if you want to give out leaflets or promote an event to commuters, as you know where to find the most people. From a travelling perspective it may also tell you which stations to avoid at certain times, if you can't handle crowds. Furthermore, if you exclude stations which are major rail termini, then you are able to see where the main attractions seem to be, judging by the passenger numbers at that station (however you'd have to be aware that some might just be busy because a lot of people work in the area, i.e. Bank/Monument and Canary Wharf). So while data such as this may not look like it has much use when it stands alone, if you gather it all and represent it in a simple visual format, it can be both interesting and useful to many people.

Far left: If you click on a station (the roundels on the map), then it shows you a zoomed in version with nearby trains.
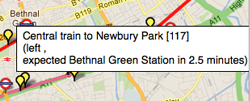
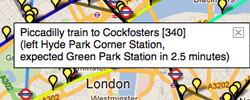
Left: The two screenshots show what happens when you click on one of the "trains" (yellow balloons). When you click, it tells you what line the train is running on, where the final destination of the train is, the train ID (the number after the destination), where the train is currently located and how long it'll be before it arrives at the next station.